Tallinn — MMXXVIOpen to rolesFinancial research · Risk · Analytical systems
Daniil
Daletski.
Testing financial ideas—and building the systems that make them usable.Five years ago I joined a 24/7 service floor; today I plan its capacity, answer for its availability KPI and sign its monthly numbers. Along the way came a finance degree with honours and the research and reporting systems this site documents — each tested the way models should be: out of sample, with the limits stated.
- Tallinn, Estonia
- 5+ yrs · 24/7 operation
- RU · EN · ET · DE
Career · Studioworks OÜ
Promoted through three roles in five years.
What this step added
- Capacity plan ownership
- Availability KPI
- Monthly reporting model
- Hiring decisions
Capability · evidence flow
Every domain traced to the work that proves it.
Languages
- 01Русский
- 02English
- 03Eesti
- 04Deutsch
Working stack
Analysis
- Python
- SQL
- BigQuery
- Advanced Excel
Modelling
- XGBoost
- Random Forest
- Elastic Net
- Panel OLS
- Tree SHAP
Risk
- VaR
- Expected Shortfall
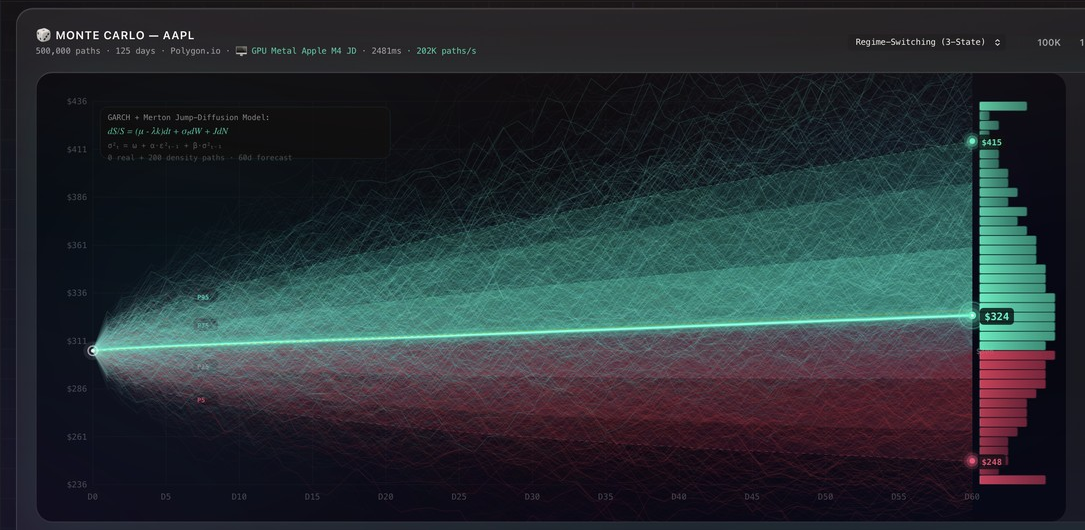
- Monte Carlo
- Stress testing
Build
- TypeScript
- Rust
- React
- Tauri
01 / Achievement index · verified outputs
Six proof points.Each opens to its evidence.
Academic distinction, empirical scale, a model result, a contractual availability KPI, native software and a deployed product—each one connected to the underlying evidence further down this page.
Evidence availableEBS · International Business Administration
↗02ThesisEmpirical scale25,876firm-week observations
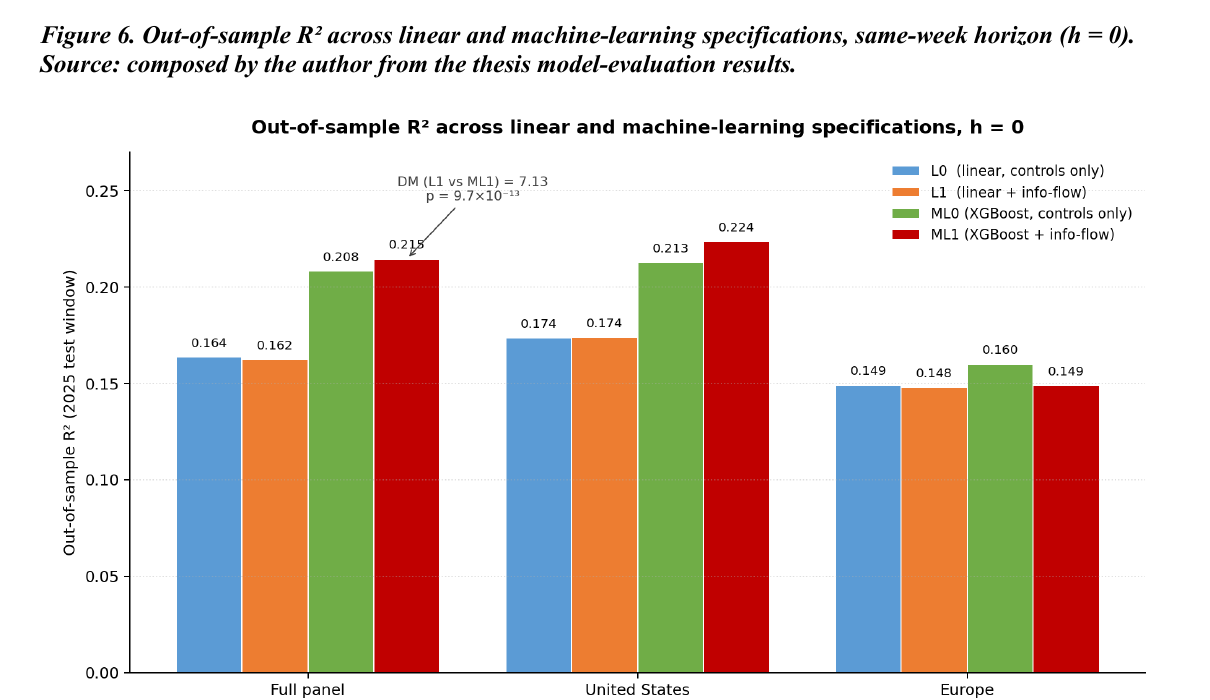
↗03Figure 6Verified model result0.2146same-week OOS R²
↗04OperationsOperational availability99.84 %across 49,800 planned hours
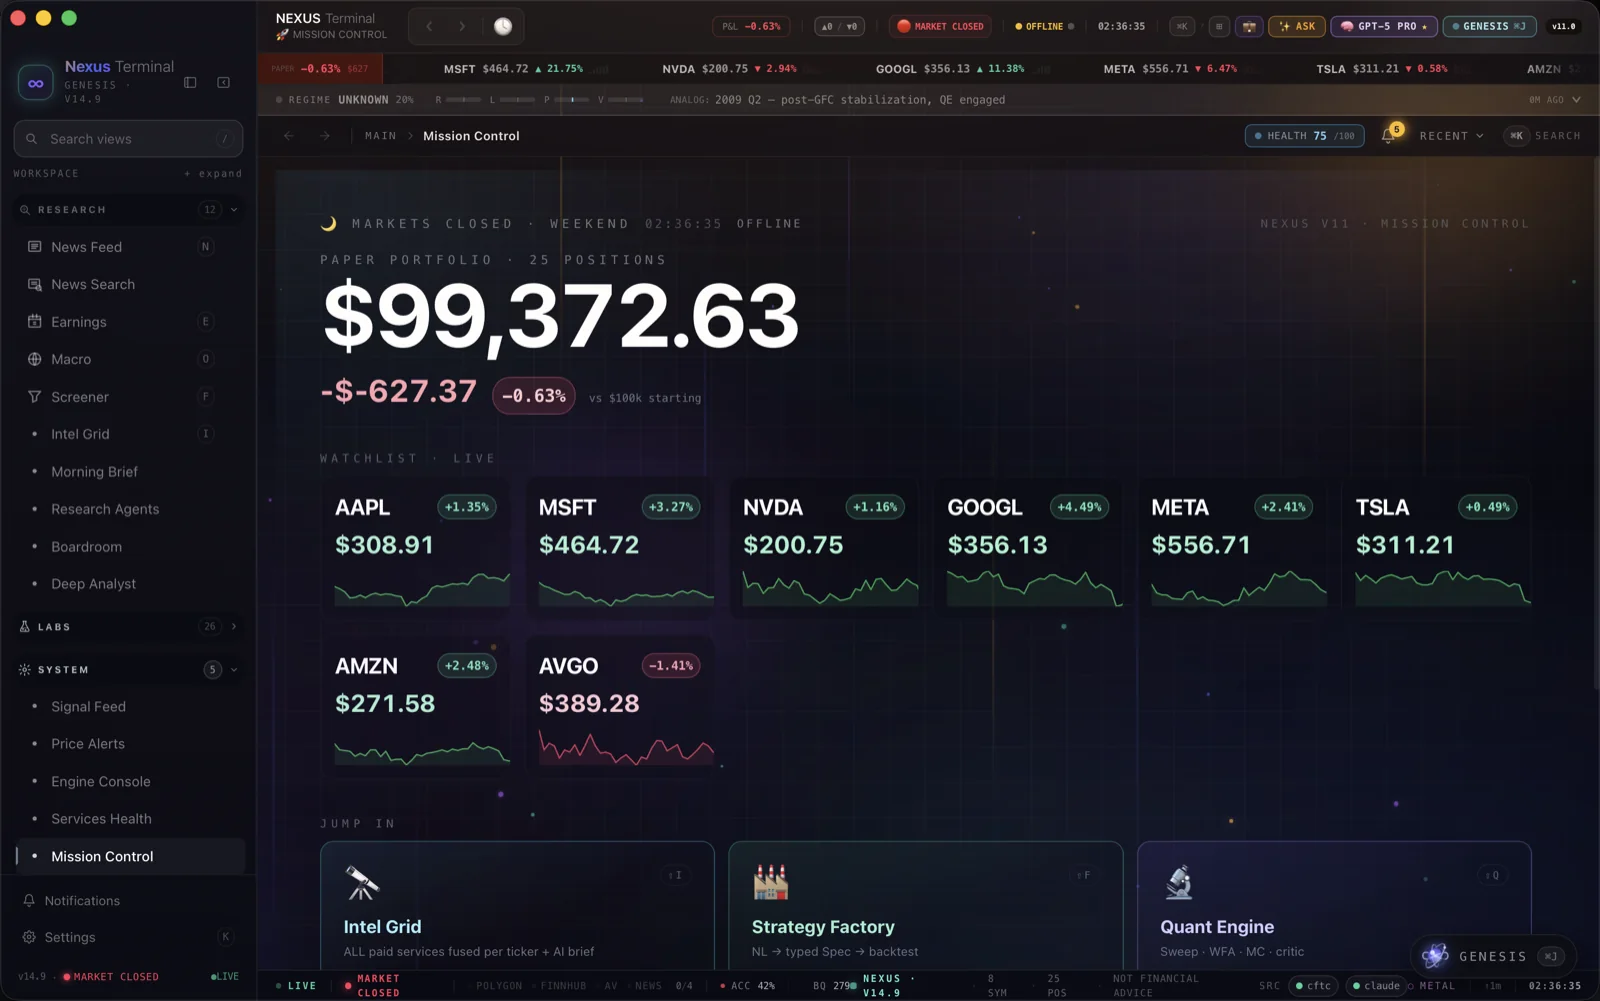
↗05NEXUSNative system96views · 67 Tauri commands
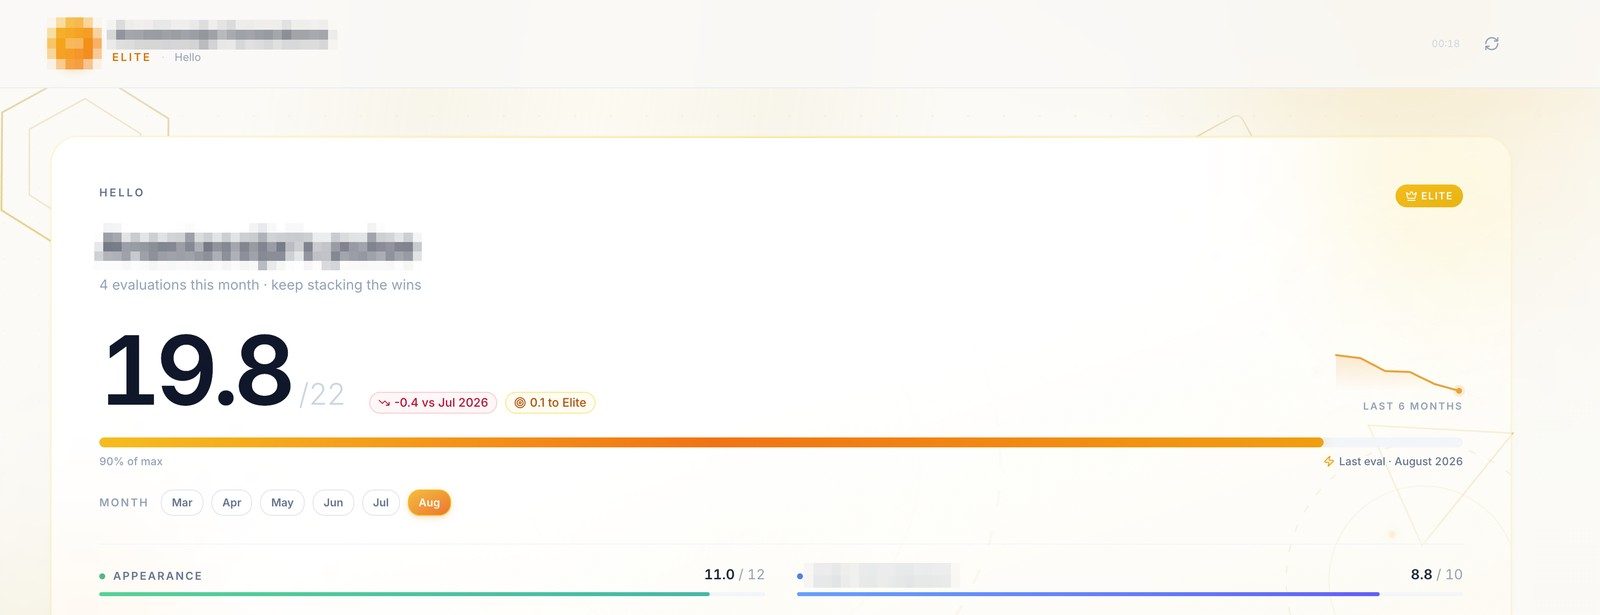
↗06ProductDeployed deliveryLIVEdaily operational performance evaluation tool
↗02 / Systems
Three systems. One discipline.
Independent applications of the same method: collect evidence, test or control the decision, and leave an auditable output. Each one states where it stops as loudly as what it achieved.
Can online attention improve weekly return models?
Yahoo Finance, Finnhub, Google Trends, NewsAPI and FinBERT / Loughran–McDonald scoring. ≈130,000 outbound calls.

At a one-week-ahead horizon, no model produced robust out-of-sample predictability. Reported explicitly; not presented as a trading rule.
03 / Professional record
Five years running the operationthat the numbers describe.
The research and the software sit on top of a working operations job: a 24/7 service floor where the capacity plan, the availability KPI and the monthly report are mine to own, defend and reconcile.
Studioworks OÜ · Tallinn, Estonia
Shift Manager — Operations, Workforce Planning & Analytics
2021 — present- 01Front-line operationsService delivery inside the 24/7 cycle.
- 02Senior operational roleQuality, escalation and shift coordination.
- 03Shift ManagerOperations, workforce planning and analytics.
- Agreed service hours
- 49,900
- Delivered
- 49,819
- Unplanned downtime
- 81 h
Jan–May 2026 planning cycles. Downtime is attributed by driver rather than absorbed into a single figure.
Coverage & supply — Demand becomes service hours, service hours become people.
- Lead a 24/7 operation with up to 61 employees concurrently scheduled across two portfolios and up to 19 service lines, balancing demand against staffing supply, skill certification and rotation constraints.
- Translate demand into service-hour and FTE requirements — up to 10,900 service hours per month, 49,800 across the Jan–May 2026 cycles — reconciled line by line against agreed service time and planned closures.
- Convert the HR-sourced FTE base into coverage and quality ratios per service line, quantifying effective staffed hours against nominal headcount to expose gaps before they reach service.
- Own the handover to Scheduling: raise coverage and feasibility constraints and keep every plan change traceable to an approved assumption.
Availability & downtime — The contractual KPI, and the 81 hours it absorbed.
- Deliver 99.84% combined availability across 49,900 agreed service hours, meeting the contractual availability KPI and holding unplanned downtime to 81 hours.
- Own the escalation and downtime register: 170 incidents across 11 monthly cycles, 168 with timed start-to-fix durations, each classified by cause.
- Rebuilt the incident resolution-time KPI as formula-driven output from source records, clearing 48 pre-existing formula errors.
- Separated downtime frequency from downtime impact: the most frequent fault category and the costliest were not the same — and redirected mitigation to the smaller, costlier driver.
Productivity assumptions — Assumption drift is a capacity risk before it is a variance.
- Test the productivity and AHT assumptions behind the plan against realised data every cycle — required service hours and FTE scale inversely with realised throughput.
- Identified a systematic drift across five consecutive cycles in a core planning input, raised it as an assumption problem rather than a one-off variance, and used quality and downtime data to separate causes.
Data & KPI governance — Every published figure traceable back to a source row.
- Own 10-sheet monthly reporting across two portfolios and 10+ KPIs, consolidating five sources in a 3,400+ formula-cell model with eight defined KPI steps.
- Validate 140,000+ records over five cycles, excluding duplicates and voided entries and resolving cross-sheet inconsistencies before publication.
- Govern a 55-code error taxonomy covering 450+ coded exception records and 190 voided transactions split by manual and system cause.
Evaluation & hiring — Scoring that stays comparable between managers.
- Run structured performance evaluation against an anchored 0–5 scale with a defined observation minimum and 10 assessments per employee per month, reconciling scoring across evaluators.
- Interview candidates and contribute directly to final hiring decisions, assessing skill and operational judgement against current and forecast coverage needs.
- Assess the staffing impact of demand and supply changes — line openings and closures, absence spikes, training lead times, attrition.
- Report assumptions, risks and trade-offs to Scheduling, HR, IT and operational leadership.
Demand becomes service hours, service hours become people.
19 service lines · two portfolios
- Lead a 24/7 operation with up to 61 employees concurrently scheduled across two portfolios and up to 19 service lines, balancing demand against staffing supply, skill certification and rotation constraints.
- Translate demand into service-hour and FTE requirements — up to 10,900 service hours per month, 49,800 across the Jan–May 2026 cycles — reconciled line by line against agreed service time and planned closures.
- Convert the HR-sourced FTE base into coverage and quality ratios per service line, quantifying effective staffed hours against nominal headcount to expose gaps before they reach service.
- Own the handover to Scheduling: raise coverage and feasibility constraints and keep every plan change traceable to an approved assumption.
Plan vs actual · KPIs owned and reported
What the data showed, and what changed because of it.
Contractual KPI met
→Downtime attributed by driver, not absorbed into one figure
Systematic drift — not one-off variance
→Re-based the service-hour requirement; flagged capacity risk
Headcount overstated available hours
→Coverage adjusted per service line before it reached service
The data existed; the KPI did not use it
→KPI rebuilt formula-driven; auditable to source
Built in-house · in production use
Three systems the operation now runs on.
Monthly Operational Performance & Availability Model
Advanced Excel · two portfolios · up to 19 service lines
Eight numbered steps from total possible hours through availability, FTE and coverage per line, to error rates and mean resolution time.
Reconciled monthly against five source feeds and reported plan-vs-actual with variance commentary.
Company-wide Employee Performance Platform
Python · SQL · web application · 136 employees
Self-initiated. Evaluations, errors, attendance, attitude and skills in one place, with role-based access and database-backed logging.
Replaced scattered manual records with a single auditable source for absence, error and skill data.
Quality Evaluation Framework & Training Tooling
HTML / JS · Excel
The framework the operation is scored against, plus an offline scenario trainer and a monthly schedule-review matrix.
Standardised how quality and coverage data enter the reporting cycle.
Additional experience
Southwestern Advantage — Texas, USA
Ran an independent sales territory through a 12-week field programme, planning daily activity from conversion data and adapting targets weekly in a fully autonomous international environment.
04 / Research dossier
Online Information Flowand Short-Term Stock Returns.
Linear and machine-learning evidence from the U.S. and European markets. Estonian Business School bachelor’s thesis, 2026 — an auditable pipeline that turns raw price, attention and news data into interpretable models, then validates them under a strict chronological design.
Test whether abnormal search activity, news intensity and financial-news sentiment add incremental information to short-horizon equity-return models after controlling for market, volatility, liquidity, size, value, momentum and sector effects.
Chronological governance
- 2021 — 2023Train
- 2024Tune, then freeze
- 2025Evaluate once
The panel · figure
Every firm-week in the study, in chronological order.
The 2025 block is touched once, after the model is frozen. Nothing to its left is re-fitted afterwards—which is what makes the out-of-sample figure below an out-of-sample figure.
Selected out-of-sample evidence · same-week horizon
Where the machine-learning gain is real — and where it is not.
Diebold–Mariano 7.13, p < 0.001 — the gain survives the test
Strongest regional result across the study
Incremental machine-learning gain not statistically significant
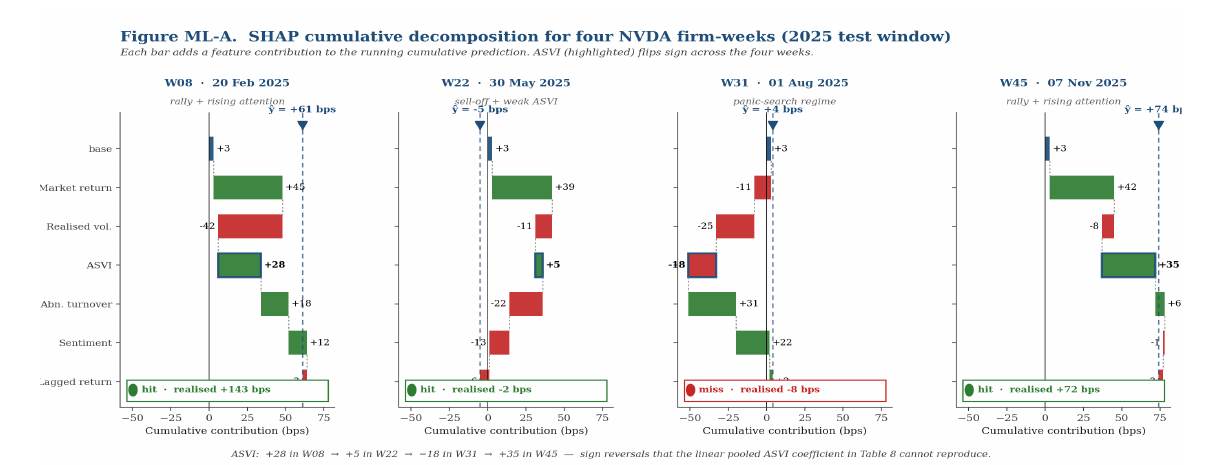
ASVI was the highest-ranked information-flow feature in SHAP attribution.
Thesis · Figure ML-A · SHAP attribution
The same feature, four regimes, three different signs.
A pooled linear model has one ASVI coefficient and must pick a single sign. Attention behaved differently in a rally than in a panic-search week—and reproducing that is where the machine-learning gain in the table below actually comes from.
At a one-week-ahead horizon, no model produced robust out-of-sample predictability.
Forecasting models did not outperform the mean-return benchmark. The thesis states this explicitly and does not present the result as a standalone trading rule. Same-week explanatory power and next-week forecasting power are different claims, and only one of them survived the test.
End-to-end capability
- 01Acquire≈130,000outbound callsAcross five external sources.
- 02Engineer13variablesASVI, news intensity, FinBERT and Loughran–McDonald sentiment.
- 03Model4specificationsPooled OLS benchmark against XGBoost, Random Forest and Elastic Net.
- 04Validate≈2,916grid fitsOne evaluation on the frozen 2025 window.
- 05AttributeSHAPper observationTree SHAP decomposition with stage-level audit logs.
Model-risk discipline
No look-ahead
Every predictor is available by the close of week t. Nothing in the feature set could only be known later.
Frozen pre-processing
Scaling and encoding are fitted on training data only, then frozen for validation and test.
One shot at the test window
A 243-setting hyperparameter grid is selected on 2024 validation alone; the 2025 window is touched once.
Negative results retained
Insignificant and regime-sensitive outcomes stay in the thesis instead of being trimmed out of the story.
- 19-module Python pipeline, plus TypeScript, Rust and SQL infrastructure
- Fixed seeds, cached inputs, version-pinned release and stage-level audit logs
- Full reproducibility set reruns from a clean clone in ≈70 minutes
Data sources
Yahoo FinanceFinnhubGoogle TrendsNewsAPIFinBERTLoughran–McDonald05 / Capability
The full toolkit,and what each part has been used on.
Four working domains. Every one of them is attached to something on this page that was actually built, tested or reported — not a self-assessed proficiency bar.
Every row is a claim. Every mark is where that claim was actually exercised. Select a body of work to see only what it proves.
Financial risk
6Quantitative methods
6Engineering & data
6Operations & workforce analytics
6Delivery & leadership
The part of the job that is not a model.
06 / Primary evidence
Open the underlying work.
Real figures and real application screens take priority over portfolio decoration. Every plate opens at full resolution.
Open artefact ↗Thesis · Figure 7 · p.48
Explainability, case by case
Four NVDA firm-weeks show attention changing sign and magnitude across market contexts.
Open artefact ↗NEXUS · Installed build
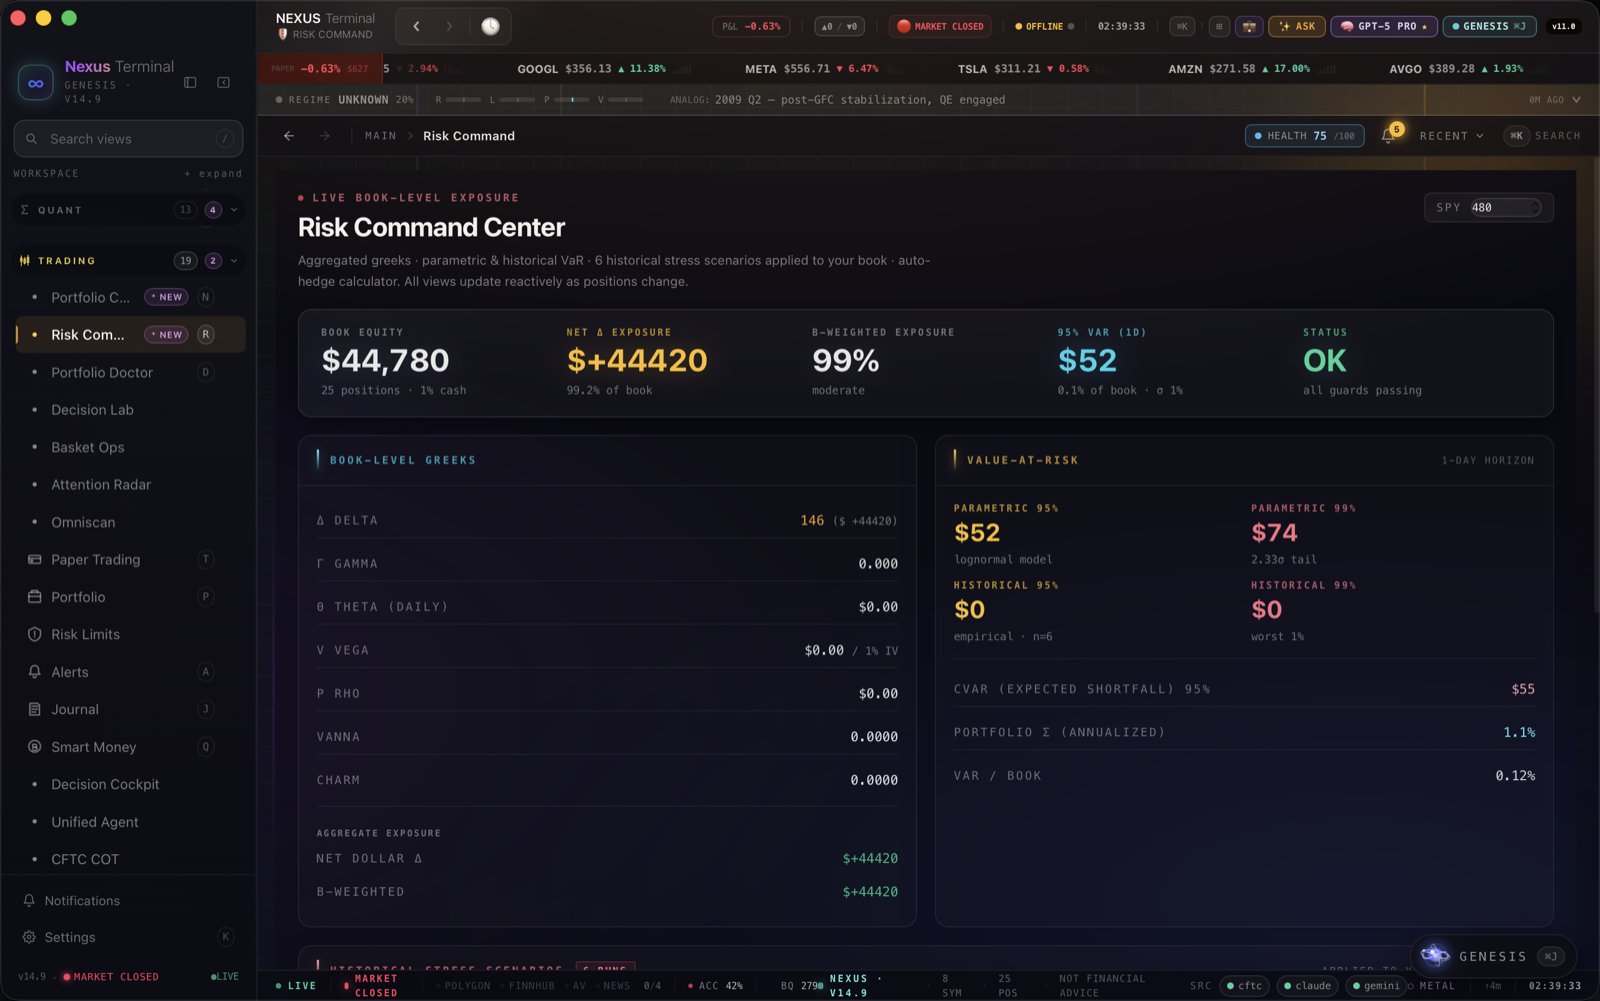
Risk Command
Exposure, Greeks, VaR, CVaR and historical stress views in a research prototype.
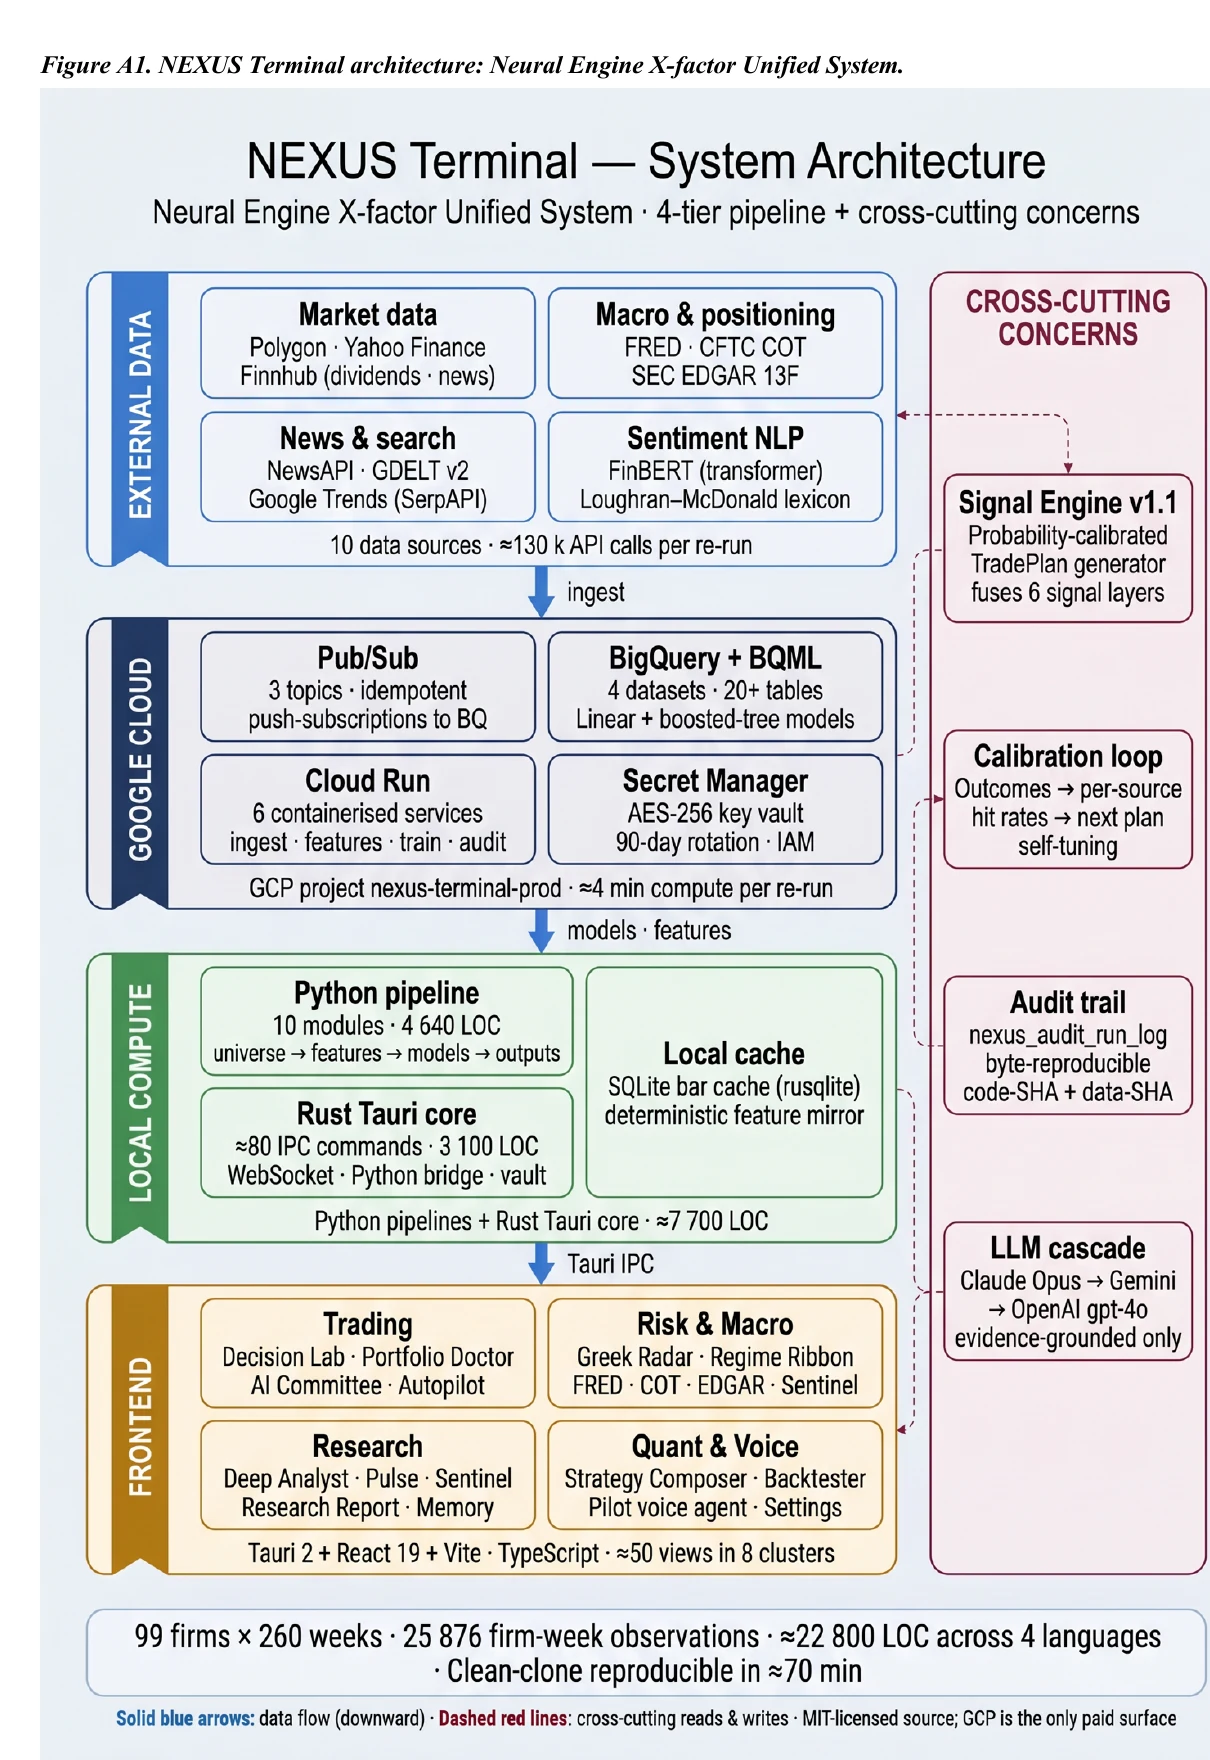
Open artefact ↗Thesis appendix · Figure A1
System architecture
The boundary between external evidence, cloud processing, local compute and audit concerns.07 / Academic distinction
Cum laude
International Business Administration
Finance-focused degree culminating in an empirical thesis that connects market attention, machine learning and an implemented analytical system.
- Value at Risk
- Expected Shortfall
- Stress & scenario analysis
- Monte Carlo methods
- Model assumptions & limitations
Additional risk foundation · Disney, $100k position
Value at Risk is a quantile, not a number.
Reads the loss straight off the observed distribution — the 5th and 1st percentile of what actually happened.
Recognition
Winner — Baltic Essay Contest in GermanAwarded for written argument in German — his fourth working language — alongside a 12-week autonomous sales programme run entirely in English in Texas.08 / Console
A working miniature of the terminal.
The panels carry the same verified figures published across this site; the VaR and valuation calculators run right here in the page on the formulas shown. No market feed, and nothing represents a live position.
Linear benchmark vs XGBoost · axis to 0.25
Daily · scales the published Disney study to your position · not advice
Two-stage DCF · 5y explicit + Gordon terminal · your inputs only — not advice
ASVI flips sign across four 2025 regimes
NEXUS · portfolio edition — published figures, plus calculators that run right here.
Type `help`, or select a module on the left.
Panel OLS, Double-clustered SE, XGBoost, Random Forest, Elastic Net, Diebold–Mariano, Tree SHAP, Out-of-sample R², Value at Risk, Expected Shortfall, Monte Carlo, Stress testing, Python, SQL, BigQuery, TypeScript, Rust, React, Tauri, Advanced Excel, Demand-to-FTE, Capacity planning, Plan-vs-actual, KPI governance.
08 / Financial risk · Quantitative research · Workforce & capacity analytics · Decision systems